May 25, 2023
Now you’re speaking my statistical programming language: Creating TLFs with R instead of SAS

By Ehab Naim
Statistical Analysis System (SAS) is a piece of software that is widely used to compile files and documents submitted to regulatory authorities. Not to be confused with SaaS (or software-as-a-service), people involved in clinical trial reporting will often refer to SAS as the “gold standard” in manipulating clinical study datasets. It has gotten to the point where there is a general misconception that regulators strictly require the use of SAS for clinical trial reporting, but this is not the case. More specifically, SAS is widely used for statistically processing clinical datasets to create Tables, Listings, and Figures (TLFs).
TLFs are files produced from data generated by study participants. Medical writers then use these files to populate clinical study reports (CSRs). If you are involved in clinical research, you have an idea about how laborious and time-consuming this process is. In addition, it requires multiple rounds of interaction between various stakeholders, like programmers, statisticians, and others. In short, this process may be made much more efficient.
This article will address two questions. The first is: Are there other ways to produce TLFs? The second is: Is there a way to do it with minimal programming experience and significantly less time and effort?
Are there other ways to produce TLFs?
Yes, there is an alternative way to produce TLFs other than SAS. The solution lies with another statistical programming language called R. R is another programming tool that has multiple packages allowing for the manipulation of clinical datasets to create TLFs. Now, do these produce similar results to SAS? Let’s explore together.
Regardless if you’re using SAS or R, datasets need to be extracted and structured in various formats. In addition, the outcome needs to be formatted with respect to font, dimension, and other aspects to fit a template.
With SAS, a combination of statements, like PROC MEANS/PROC SUMMARY/PROC UNIVARIATE, are used to summarize datasets into descriptive statistics, such as mean, median, sum, and other metrics like standard deviation. In addition, prompts such as PROC GENMOD/PROC MIXED are used to define the order in which data populate and display statistical measures for longitudinal data (information related to the same subject across various time points). Finally, data are fed into the PROC REPORT prompt to produce the reports. To extract the outcome in an RTF format, extra styling commands need to be added.
Using R, the same job can be done via multiple pathways. For example, a code that calculates each summary can be written and then arranged to get descriptive statistics. Or, source data could be rearranged using numeric and character variables for a time point; then, results are wrapped with dedicated functions.
Narrativa’s solution takes it a step further and uses multiple tools for the best possible result. Check out Figure 1 below, then continue reading.
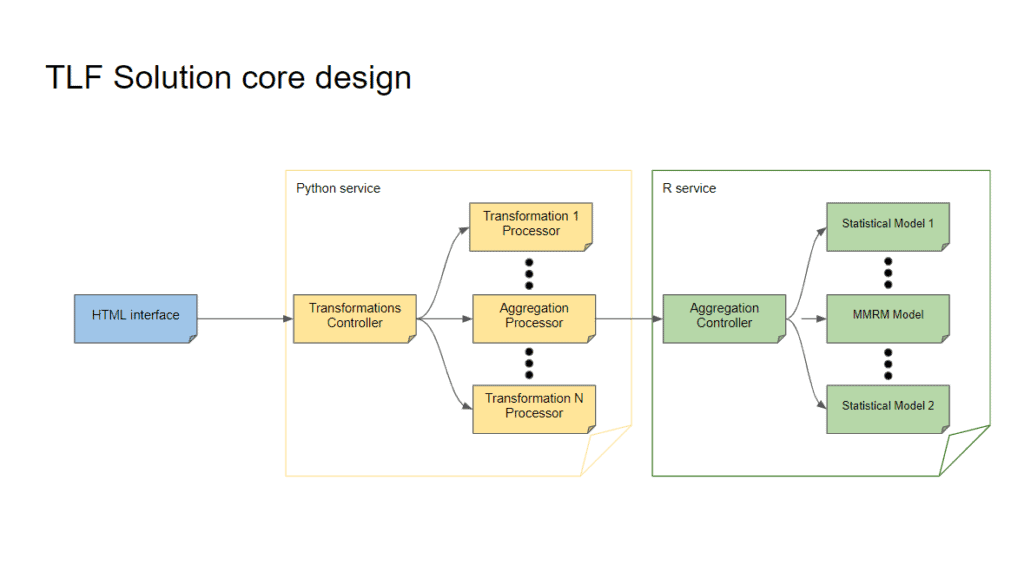
Figure 1: Narrativa’s TLF solution workflow based on our platform. Creating TLFs with R instead of SAS
Narrativa’s solution uses a complex interactive pattern between Python and R to handle increasingly complex data outcomes. In this context, Python is used as an orchestrator that directs and feeds data into R. In addition, Python handles simple calculations, like mean, median, counts, and other sets of operations. While complex aggregations, like Kaplan-Meier’s survival analysis, mixed models for repeated measures, and other complex statistical models are fed into R for processing. When R finishes, Python oversees several additional operations, including styling the outcome, creating figures based on R results, and much more!
Why is R better than SAS?
The use of R offers far better code reusability compared to SAS. In addition, unlike SAS, R supports decoupling calculation code lines from those used to present data—which is considered a best practice in software engineering. If you exclude the lines used for loading libraries and SAS options, you will notice that the overall code lines are less with R, suggesting that R offers a more compact solution in analyzing and summarizing data compared to SAS.
Is there a way to do it with minimal programming experience and significantly less time and effort?
Narrativa provides the technology to make your life easier! While it is important to have programming language knowledge to produce the outcomes needed using SAS or R, with Narrativa’s solution however, you do not need to know these programming languages at all to produce outputs. It just requires a basic understanding of statistics to do the job.
On the user interface, ADaM data are loaded into the platform. The user is then presented with several options to choose from. Once selected, a table is produced, which can then be exported into a Word document or rich text format (RTF).
You can see some TLF outcomes produced by our solution below in Figure 2. Styling, legend, titles, and footnotes are purposefully left out, as these are adaptable to any template.
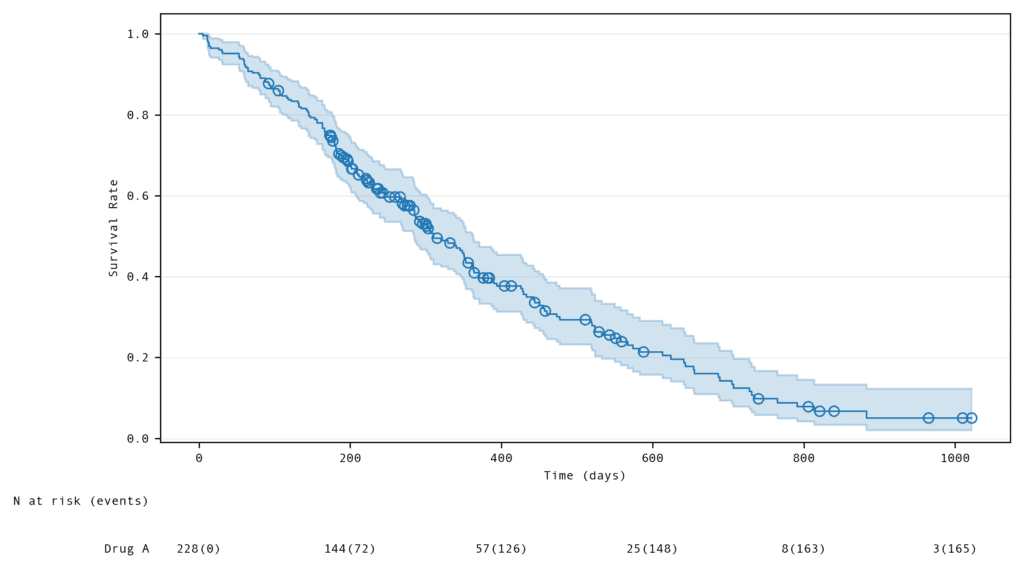
Figure 2: Example of survival analysis outcome using Narrativa’s solution. Circles in the figure are censored data points. Creating TLFs with R instead of SAS
In addition to the TLFs solution, Narrativa offers other tools that support clinical research and regulatory documentation and submission professionals. The redaction and anonymization solution is an example of these tools. This solution scans thousands of documents within few minutes to anonymize and redact critical information that could compromise the privacy of trial participants.
About Narrativa
Narrativa is an internationally recognized B2B content services company that believes people and artificial intelligence are better together. Through its proprietary generative AI content automation platform, teams of all types and sizes are empowered to build and deploy smart composition, business intelligence reporting, and process optimization content solutions for internal and external audiences alike. Its tech stack, consisting of data extraction, data analysis, natural language processing (NLP) and natural language generation (NLG) tools, all seamlessly work together to produce content quickly and at scale. In this way, Narrativa supports the growth of businesses across a variety of industries, while also saving them both time and money. Accelerate the potential with Narrativa.
Contact us to learn more about our solutions!
Share